This article was originally posted to DrivingSales.com
You already know that marketing is a key component to selling and servicing more vehicles. But do you know just how well your marketing works for your dealership?
To get a clear answer to that question, you’ll need to know what to measure and how your metrics stack up. Only then can you really identify what’s performing well and what may need some adjustments.
Prepare for the 5 make-or-break moments that can cause service customers to start going elsewhere.
Metrics to Measure
The specific metrics you use to gain insight into your marketing performance will depend on the strategy or strategies you’ve selected – if you aren’t running a social media campaign, social engagement metrics probably won’t offer you much.
With that in mind, we’ve gathered the top 8 metrics you should be measuring (as well as some benchmarks). So the next time someone asks, you’ll be able to say for certain that your car dealership marketing is running at peak performance.
1.Social Engagement Metrics
Social media offers a bevy of metrics to track and analyze, making it easy to know how well your campaign is performing. And while metrics like clicks, shares, comments, and likes won’t give you insight into how many new customers a social campaign ultimately generated, it does offer some great leading indicators to track.
A Good Benchmark: Thanks to Socialinsider, who published a comprehensive report on industry specific benchmarks, we have a clear picture of engagement rates across platforms.
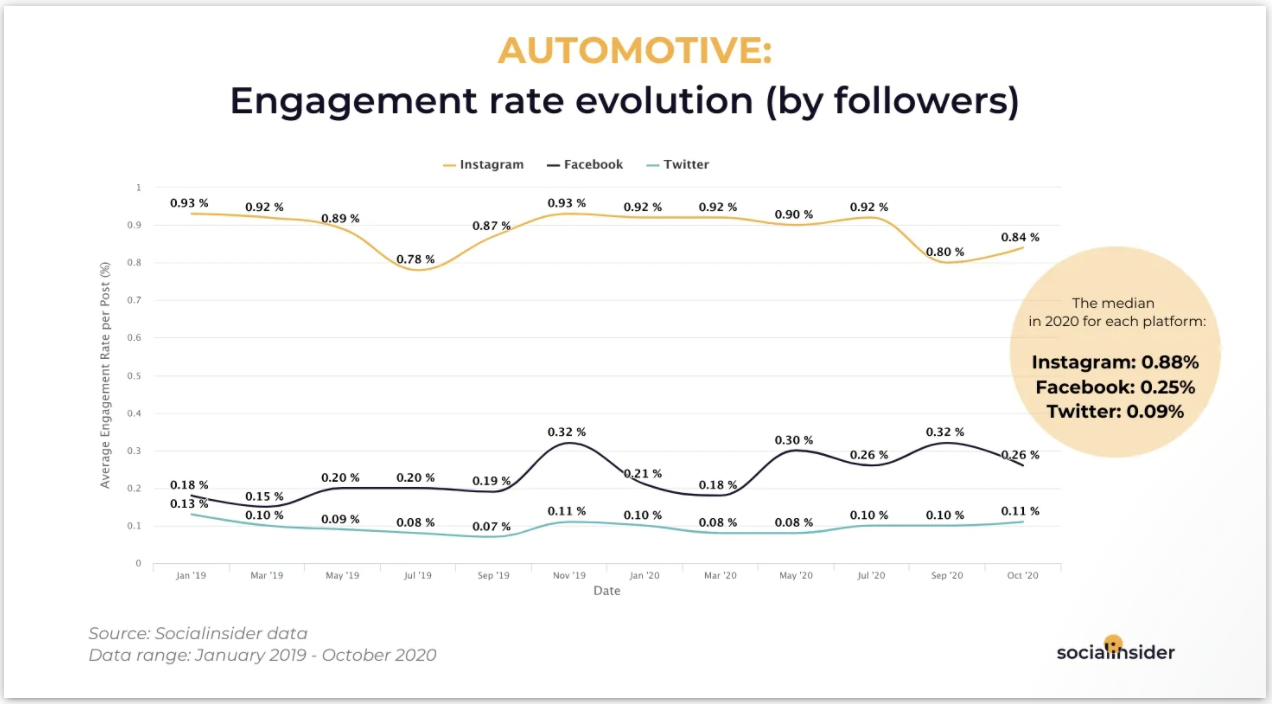
Strategies to Improve: Social media is all about connecting, so if you aren’t seeing a ton of engagement on your own posts, try going out and engaging on others. Getting your name out in the industry will draw a crowd back to you and help to boost your metrics the next time around.
2. Email Metrics
Similar to social media, email marketing is a smorgasbord of measurement: delivers, opens, click-throughs. It’s metric utopia and will give you some critical insight into who exactly is seeing your marketing and any follow-up action they are taking.
A Good Benchmark: According to Campaign Monitor, a few of the average benchmarks (across industries) break down like this:
- Open: 18%*
- Click-Through: 2.6%
- Click-to-Open: 14.1%
- Unsubscribes: 0.1%
*Note that due to some changes in how Apple devices handle email, open rate benchmarks are likely to change significantly in the near future and may no longer be a reliable email metric to track.
Strategies to Improve: Not seeing the results you want, check out your email list. If you haven’t scrubbed your list recently – removing any outdated or inaccurate information – you could be setting yourself up for failure. Beyond that, let your metrics show you where to improve:
- Lagging open rates? Do some testing on your subject lines.
- Poor click-through or click-to-open rates? Make sure that the content in the email is valuable to the reader and that your calls to action are clear.
- High unsubscribe rate? Check if you’re adding people to your email lists who shouldn’t be added, ensure you aren’t sending too many emails, and be critical about whether your emails are truly valuable to your audience.
3. Search Rankings
Google search is a fiercely competitive landscape and ranking on the first page for a search term doesn’t just happen because you added some new content to your website. If you want to rank for your target keywords, you’re going to have to be diligent about creating the right kind of content that answers your target audiences search queries.
A Good Benchmark: While not an exact benchmark, a BrightEdge study found that organic search comprises 53% of all website traffic. Which means a great place to start measuring your SEO results is by measuring any increases in traffic and examining where that traffic is coming from using tools like Google Analytics.
Strategies to Improve: Beyond your keyword research, there are a couple of quick and easy tactics to optimize your content for improved SEO ranking:
- Be sure that your website is easy to navigate and loads quickly, especially on mobile devices
- Include descriptive H1, H2, and H3 headings with your keyword (but be careful not to simply repeat the keyword over and over again in your content)
- Always include alt text for images, graphs, charts, etc.
- Make sure your website’s content is accurate, valuable to the reader, and fully answers or addresses the search term or phrase you want to rank for
4. Cost Per Lead (CPL)
Investing in paid ads on platforms like Google and Facebook can be a great strategy for reaching new, targeted individuals – with the level of segmentation available, these ads are served directly to an audience most interested in the services your car dealership provides. However, paid ads can also be a colossal waste of money. Measuring your cost per lead (CPL) will help determine if the benefits (number of leads) really do outweigh the costs.
A Good Benchmark: Lion Tree Group found that the cost-per-lead for the auto industry fell just above $200.
Strategies to Improve: If you’re seeing a higher CPL than your comfortable with, it might be time to try optimizing your ads – switch out your imagery, change up your copy, or maybe try a new promotion altogether. Whatever it is, it could be your key to decreasing costs and increasing new leads.
5. Website Traffic (Total vs. Unique Visits)
The traffic to your website is a direct result of your marketing outreach strategies and will definitively tell you how many people are actually taking the action to click through to your site. But be careful, one person might visit your site multiple times and skew your report, so it’s important to measure both total visits and unique visits.
A Good Benchmark: Unfortunately there isn’t a solid benchmark for this metric because it will vary significantly from one dealer to the next based on the size of your dealership, the size of the area you serve, and many other factors. The best thing to do is measure your traffic and watch for changes over time, especially changes that coincide with changes to your marketing efforts.
Strategies to Improve: Website traffic is a good indicator of the overall effectiveness of your marketing strategies so there isn’t a single strategy for increasing it. However, if you’re struggling to grow website traffic despite a robust marketing strategy, be sure your URL is easy to remember and type, that you’re following basic SEO best practices, that you’ve claimed and updated your Google My Business listing, and that your dealership is listed in any relevant local business directories.
6. Website Conversion Rate
Your conversion rate is the number of prospects who converted into a new sale divided by the total number of visitors to your website. This should tell you how well your website acts as a marketing tool, driving new customers to your dealership.
A Good Benchmark: According to a ContentSquare report, the average conversion rate for the automotive industry is 0.4%.
Strategies to Improve: Converting leads to sales is the final push of any marketing effort, and arguably the most important. If your website isn’t performing, it can feel a little like fumbling the ball at the five-yard line.
How do you improve? Start A/B testing. Defining and testing how specific aspects of your site perform will help you determine exactly where the problem lies…without having to do a complete website overhaul.
7. Attrition/Retention
Customer loyalty and retention is one of your most valuable commodities and should be a main objective for any marketing initiative.
A Good Benchmark: Statista reports an average retention rate of 83% for the automotive and transportation industry.
Strategies to Improve: Partnering with a renewable benefits provider like DriveSure creates an incentive for customers to stay loyal to your shop and continue to come back for services – no matter how big or small. In fact, according to our most recent survey, 84% of respondents stated that DriveSure benefits make them more likely to return to their dealership for their next oil change.
8. Total Spend
And finally, the dollars and cents. How much have you spent in total? Did you exceed your budget? Were the results good enough to increase your budget for next quarter or next year?
What level of investment did you make and how would you rate your return?
A Good Benchmark: According to the NADA Data 2020 report, the average dealership spent $450,094 on advertising in 2020, or about .8% of their total sales.
Strategies to Improve: Spending too much and not seeing the kind of results you had hoped for? Audit your marketing strategy with a specific focus on channels and content.
- Channels: Cost can very drastically between channels, so it’s important to note if one channel is outperforming another.
- Content: Not every piece of content is right for every channel. Determine the type of content that channel’s audience finds more relevant and engaging and adjust from there.
Ready to see how well your marketing is working? Define your metrics and start measuring
Master These Moments to Keep Your Customers
Discover the 5 critical moments causing customers to abandon your dealership service department, and how you can overcome them.